
Very good examples of Superoverlay 1.5 Pro public Matt Fox
It is California Geologic Maps and Geologic Map of the United States by USGS
Nice professional work, good examples. Enjoy!


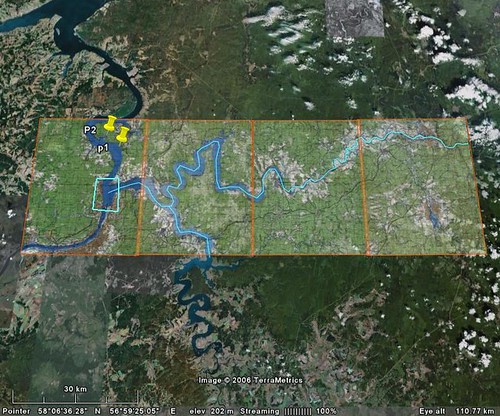
 Global AIS KML Download


Global Paleogeography
Global Paleogeographic Views of Earth History - Late Precambrian to Recent The globes presented in this series show how Earth may have appeared over the last 600 million years (Ma).
Credits: Dr. Ron Blakey Professor of Geology
Download KML: Network link
Earth observatory
Large datasets collection (>30). Time animation.
Credits: Earth observatory.
Download KML: Network link
AERONET La Jolla
Spreedsheets at calculator links and time animation. AERONET_La_Jolla. Terra. Time animation. 2006.
Pixel size: 2km, 1km, 500m, 250m.
Editgrid XML+XSL.Images group by month.
Credits:
Modis rapid response system.
Download KML: Network link
Path calculator
Spreedsheets at calculator for generation of points, segments and path. All lengths calculate by Great circle distance formula (km, mi).
Download KML : Network link
Fire maps
Spreedsheets at calculator links and time animation.
Editgrid XML+XSL.Images group by month.
Wildfire :
- small 600x300
- med 2048x1024
- large 4096x2048
- xlarge 8192x4096
Credits:
MODIS Rapid Response System Global Fire Maps
Download KML: Network link
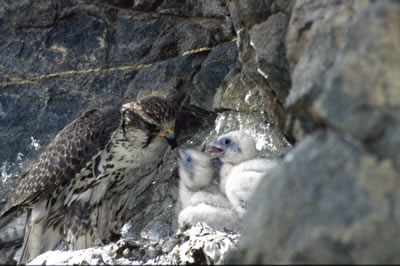
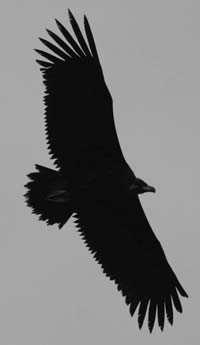
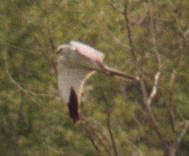
Birds fly
Spreedsheets at calculator generate points, segments and path. Time animation. All lengths calculate by Great circle distance formula (km, mi). Generation KML for user datasets. Intergration to Googlegeo ( GE & GMaps ). Datasets and photos by Eugene Potapov.
Download KML: Network link


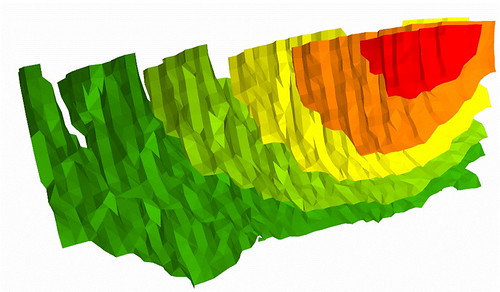
Create GRID and points feature class by selected source layer and Z attribute.
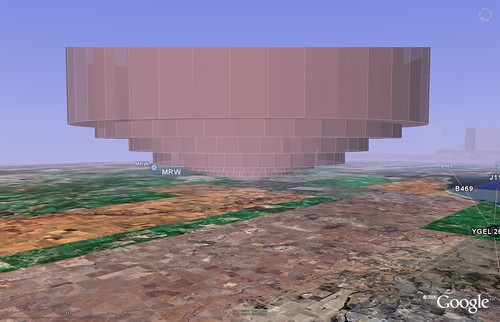
How Kriging works.
Kriging is an advanced geostatistical procedure that generates an estimated surface from a scattered set of points with z values. Unlike the other interpolation methods, Kriging involves an interactive investigation of the spatial behavior of the phenomenon represented by the z values before the user selects the best estimation method for generating the output surface.
Source layer.
Select point, line or polygon feature class from current document.
Z attribute.
Select Z attribute from list of fields for current feature class.
Output group.
The Variogram method dialog box has several models to choose from. When the Kriging method is set to Ordinary, the available models are Spherical, Circular, Exponential, Gaussian, and Linear. When the Kriging method is set to Universal, the available models are Linear with linear drift and Linear with quadratic drift. The Universal Kriging types assume that there is a structural component present and that the local trend varies from one location to another.
The advanced parameters allow control of the variogram used for Kriging. A default value for Lag size is initially set to the default Output cell size. For Major range, Partial sill, and Nugget, a default value will be calculated internally if nothing is specified.
The optional output variance of prediction raster contains the kriging variance at each output raster cell. Assuming the kriging errors are normally distributed, there is a 95.5 percent probability that the actual z-value at the cell is the predicted raster value, plus or minus two times the square root of the value in the prediction raster.
Low values within the output variance of prediction raster indicate a high degree of confidence in the predicted value. High values may indicate a need for more data points.
Native Kriging by selected features (points, polylines, polygons) class.
Tools for make of the interpolations lines.
Create 3D points feature class by selected source layer with Z and additional attribute.
Native 3D-Kriging by selected features (points, polylines, polygons) class.
Tools for make of the 3D interpolations lines.
Tools to generation of feature classes by direction.
Tools for make of triangle polygon layer by points.
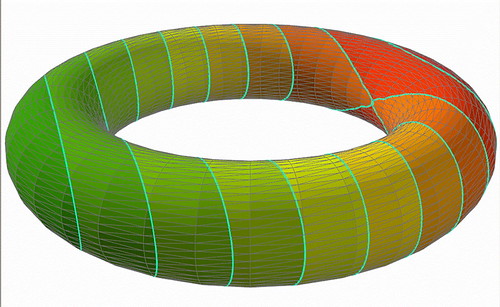
Create isosurfaces by 3D points theme and attribute.
Create isolines on surfaces, sections and other triangles mesh.
Convert selected from drop down list raster to Output Points layer
Set 3d values to points (verticles) for the selected source layes. Uses attributes of the source layer, GRID or constant value.
Make 3D grid of points with random values.
Make grid of points with random (0..1) values.


