Home page http://geoselect.geoblogspot.com/
Download Geoselect 10 install
Buy It - buy Geoselect, Geoselect 10 or update Geoselect to Geoselect 10


Copy Source | Copy HTML- function astergdem(lat,lng) {
- /*
Elevation - Aster Global Digital Elevation Model
Parameters : lat,lng; sample are: ca 30m x 30m, between 83N and 65S latitude.
Result : a single number giving the elevation in meters according to aster gdem,
ocean areas have been masked as "no data" and have been assigned a value of -9999
*/
- var url = "http://ws.geonames.org/astergdem?lat="+lat+"&lng="+lng;
- var response = UrlFetchApp.fetch(url);
- var str = response.getContentText();
- return str;
- }
-
- function srtm3(lat,lng) {
- /*
Elevation - SRTM3
Shuttle Radar Topography Mission (SRTM) elevation data.
The dataset covers land areas
between 60 degrees north and 56 degrees south.
This web service is using SRTM3 data with data points located
every 3-arc-second (approximately 90 meters) on a latitude/longitude grid.
Parameters : lat,lng;
sample area: ca 90m x 90m
Result : a single number giving the elevation in meters according to srtm3,
ocean areas have been masked as "no data" and have been assigned a value of -32768
*/
- var url = "http://ws.geonames.org/srtm3?lat="+lat+"&lng="+lng;
- var response = UrlFetchApp.fetch(url);
- var str = response.getContentText();
- return str;
- }
-
- function gtopo30(lat,lng) {
- /*
Elevation - GTOPO30
GTOPO30 is a global digital elevation model (DEM)
with a horizontal grid spacing of 30 arc seconds (approximately 1 kilometer).
Result : a single number giving the elevation in meters according to gtopo30
*/
- var url = "http://ws.geonames.org/gtopo30?lat="+lat+"&lng="+lng;
- var response = UrlFetchApp.fetch(url);
- var str = response.getContentText();
- return str;
- }
Copy Source | Copy HTML- function ocean(lat,lng) {
- /*
returns the ocean or sea for the given latitude/longitude
*/
- var url = "http://ws.geonames.org/oceanJSON?lat="+lat+"&lng="+lng;
- var response = UrlFetchApp.fetch(url);
- var str = eval('(' + response.getContentText() + ')').ocean.name;
- return str;
- }
-
- function countryCode(lat,lng) {
- /*
returns the iso country code of any given latitude/longitude
*/
- var url = "http://ws.geonames.org/countryCode?lat="+lat+"&lng="+lng;
- var response = UrlFetchApp.fetch(url);
- var str = response.getContentText();
- return str;
- }
-
Copy Source | Copy HTML- /* - - - - - - - - - - - - - - - - - - - - - - - - - - - - - - - - - - - - - - - - - - - - - - - */
- /* Latitude/longitude spherical geodesy formulae & scripts spreadsheets interface */
- /* Credits - www.movable-type.co.uk/scripts/latlong.html */
-
-
- function GCDist(lat1, lon1, lat2, lon2) {
- // Return Great Circle Distance between points calculation
- var p1 = new LatLon(lat1, lon1);
- var p2 = new LatLon(lat2, lon2);
- var dist = p1.distanceTo(p2); // in km
- return dist;
- }
-
- function Bearing(lat1, lon1, lat2, lon2) {
- // Return Bearing between points calculation
- var p1 = new LatLon(lat1, lon1);
- var p2 = new LatLon(lat2, lon2);
- var brng = p1.bearingTo(p2); // in degrees clockwise from north
- return brng;
- }
-
- function Midpointlat(lat1, lon1, lat2, lon2) {
- // Returns the midpoint latitude between this point and the supplied point.
- var p1 = new LatLon(lat1, lon1);
- var p2 = new LatLon(lat2, lon2);
- var midp = p1.midpointTo(p2); // in deg
- return midp._lat;
- }
-
- function Midpointlon(lat1, lon1, lat2, lon2) {
- // Returns the midpoint longitude between this point and the supplied point.
- var p1 = new LatLon(lat1, lon1);
- var p2 = new LatLon(lat2, lon2);
- var midp = p1.midpointTo(p2); // in deg
- return midp._lon;
- }
-
- function Destpointlat(lat1, lon1, bearing, distance) {
- // Returns the destination point latitude from this point having travelled the given distance (in km) on the
- // given initial bearing (bearing may vary before destination is reached)
- var p1 = new LatLon(lat1, lon1);
- var midp = p1.destinationPoint(bearing, distance); // in degrees clockwise from north
- return midp._lat;
- }
-
- function Destpointlon(lat1, lon1, bearing, distance) {
- // Returns the destination point longitude from this point having travelled the given distance (in km) on the
- // given initial bearing (bearing may vary before destination is reached)
- var p1 = new LatLon(lat1, lon1);
- var midp = p1.destinationPoint(bearing, distance); // in degrees clockwise from north
- return midp._lon;
- }
-
Putting Blend 4, Visual Studio 2010 and ESRI ArcGIS Web Mapping in a working system. To view the maps, you must install SilverLight 4. On clicking the right mouse button on the map, we can install it as a local application. After installation, when re-click the right button, we can remove the application

- function GCD1(lat1, lon1, lat2, lon2) {
- // Return Great Circle Distance between points calculation
- function radians(a) {
- var outNum =Math.PI*a/180;
- return outNum;
- }
-
- var R = 6372.795;
- var d1=Math.sin(radians(lat1))*Math.sin(radians(lat2))+Math.cos(radians(lat1))*Math.cos(radians(lat2))*Math.cos(radians(lon2)-radians(lon1));
- var d2=Math.cos(radians(lat2))*Math.sin(radians(lon2)-radians(lon1));
- var d3=Math.cos(radians(lat1))*Math.sin(radians(lat2))-Math.sin(radians(lat1))*Math.cos(radians(lat2))*Math.cos(radians(lon2)-radians(lon1));
- var len=R*Math.atan2(Math.sqrt(d2*d2+d3*d3),d1);
- return len;
- }
- function getKML(placeName) {
- // Return KML by placename
- if (placeName == "") {
- return "You have to write the name the place"
- }
- var url = "http://maps.google.com/maps/geo?q="+ placeName+"&output=kml";
- var response = UrlFetchApp.fetch(url);
- var str = response.getContentText();
- return str;
- }
- function getLngLat(placeName) {
- // Return LngLatitude by placename
- if (placeName == "") {
- return "You have to write the name the place"
- }
- var url = "http://maps.google.com/maps/geo?q="+ placeName+"&output=json";
- var response = UrlFetchApp.fetch(url);
- var str=eval('(' + response.getContentText() + ')').Placemark[ 0].Point.coordinates;
- return str;
- }
- function getLng(placeName) {
- // Return Longitude by placename
- if (placeName == "") {
- return "You have to write the name the place"
- }
- var url = "http://maps.google.com/maps/geo?q="+ placeName+"&output=json";
- var response = UrlFetchApp.fetch(url);
- var str=eval('(' + response.getContentText() + ')').Placemark[ 0].Point.coordinates[ 0];
- return str;
- }
-
- function getLat(placeName) {
- // Return Latitude by placename
- if (placeName == "") {
- return "You have to write the name the place"
- }
- var url = "http://maps.google.com/maps/geo?q="+ placeName+"&output=json";
- var response = UrlFetchApp.fetch(url);
- var str=eval('(' + response.getContentText() + ')').Placemark[ 0].Point.coordinates[1];
- return str;
- }
-
- function getAddress(placeCoord) {
- // Return Address by placeCoord (reverse geocoding) placeCoord=lat,lng
- if (placeCoord == "") {
- return "You have to write the name the place"
- }
- var url = "http://maps.google.com/maps/geo?q="+ placeCoord+"&output=json";
- var response = UrlFetchApp.fetch(url);
- var str=eval('(' + response.getContentText() + ')').Placemark[ 0].address;
- return str;
- }


 |
| Альбом: GE work |


| License | Standard | Plus | Pro |
| Import (except shp) | x | x | x |
| Import (include shp) | x | x | |
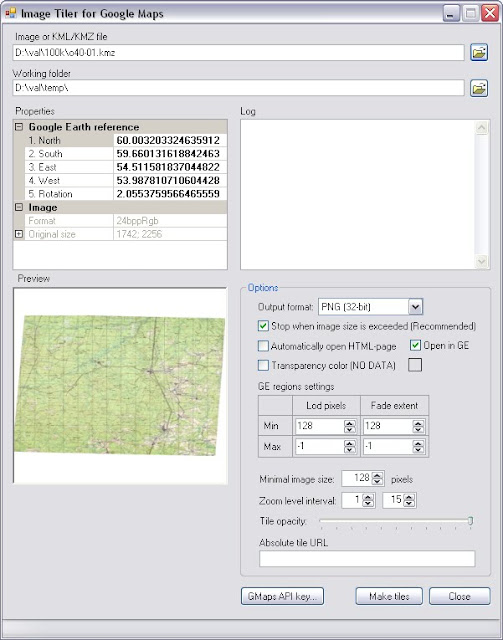
| GMaps Tiler Improved! | x | x | x |
| Create Screenoverlay New! | x | x | x |
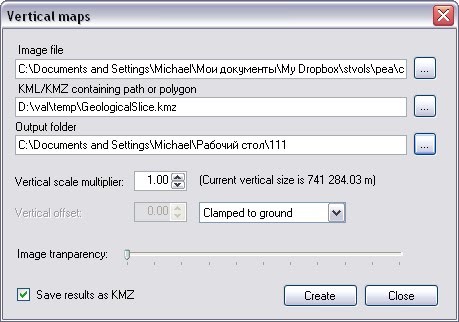
| Vertical mapper New! | x | x | x |
| Regions | x | x | x |
| Assembly | x | x | x |
| Distribute | x | x | x |
| Reorganize | x | x | x |
| Photo track | x | x | |
| 3D Surface | x | x | |
| KML to 3D | x | x | |
| Superoverlay PRO | x |


 My geolocation
 My email
 My phone number
 Contact information


